Employment, unemployment profile
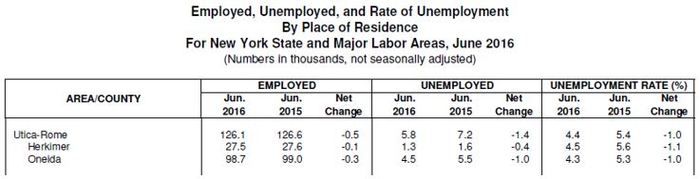
Herkimer County has maintained a reasonably comparable level of employment (or unemployment) when compared to other counties within New York State. The following tabular information provides specific information regarding Herkimer County. The 2016 figures show that Herkimer County employment has declined slightly when compared to 2015.
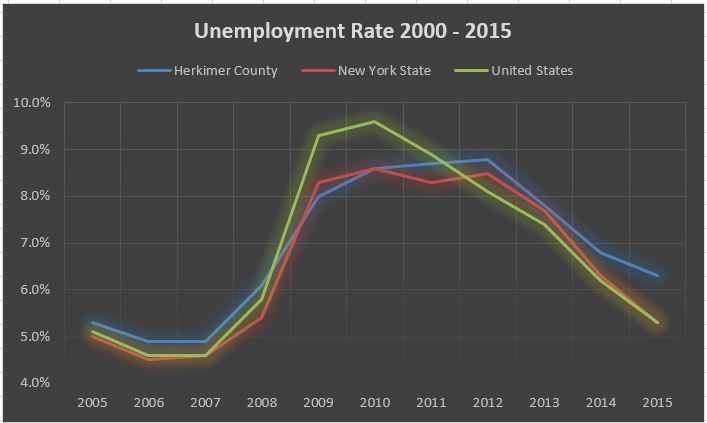
The graph below provides unemployment levels from 2005-2015 comparing Herkimer County with NY State and US levels. Herkimer County has had an Average Unemployment rate of 6.9% compared to New York State's Average of 6.6% and the US Average of 6.8%.
This employment information was provided by the Mark Barbano, Mohawk Valley Regional Economist at the NY State Department of Labor office in Utica, NY.
Below are the full PDF documents that were the source of the above labor information.
| unemployment_rate_rankings_over_time_-_jun_2016.pdf |
| unemployment_rates_-_june_2016.pdf |
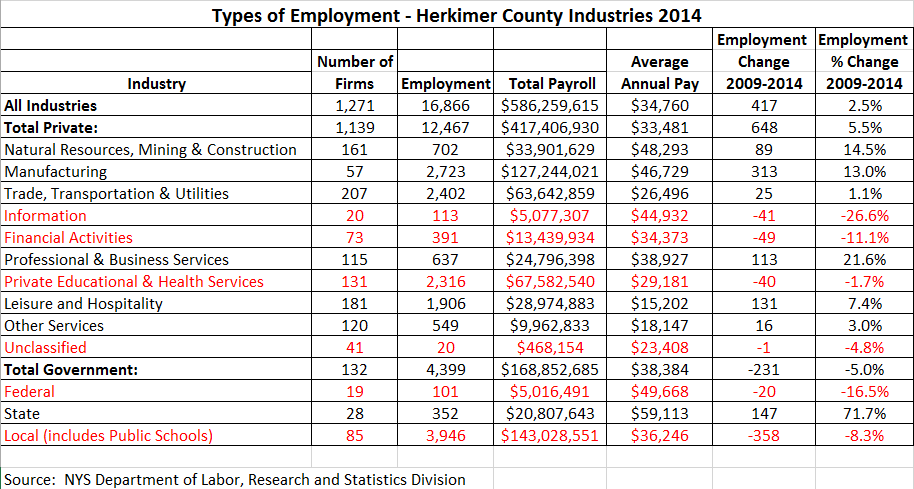
Below is a table detailing the types of employment that are present in Herkimer County, with details on the number of firms, employee count, total payroll, average annual pay, and the change in employment between the years of 2009 and 2014.
It shows the industries of Information, Financial Services, and Federal employment have decreased by double digit percentages, while Natural Resources, Manufacturing, Professional & Business Services and State employment have increased by double digit percentages.
It shows the industries of Information, Financial Services, and Federal employment have decreased by double digit percentages, while Natural Resources, Manufacturing, Professional & Business Services and State employment have increased by double digit percentages.
More statistical information is being prepared and will be posted as soon as it is formatted. Stay tuned.