
This section provides collective statistics that will set the basis for the current state of the Village of Herkimer and will be selectively referenced when defining the vision of the future state of the Village of Herkimer. The primary source of these statistics are derived from the U.S. Census Bureau (via Dale Miller, Principal Planner, Herkimer Oneida County Comprehensive Planning Program), which has been established by means of updating their census data through an interactive and on-going survey process called the American Community Survey. There are selective statistics the influenced this section from the New York State Department of Labor (via Mark Barbano, Mohawk Valley Regional Economist, Research and Statistics Division); and from the on-line web site referred to as Sperling's Best Places web site located (at the time of this document’s creation) on the internet at URL address http://www.bestplaces.net/economy/zip-code/new_york/herkimer/13350.
NOTE: Many of the statistics presented in this section had been posted on the Master Plan 2020 web site (http://www.voherkimer2020.com/) for public review throughout the development of this document.
The reason that these statistics are provided in a collective manner in this section, rather than associating each statistical profile in the various Characteristic Group they apply to, is because those later sections are focused on defining the future vision. Therefore these statistics will only be referenced in those later sections to support comparisons between the current state and the future state of the Village of Herkimer.
Therefore, to provide a logical sequence of these statistics, this section of the Master Plan 2020 will apply the following flow to provide some level of cause-effect association of the various demographic and industrial profiles of the Village:
Population
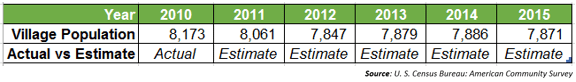
The population of the Village is referenced (per the US Census Bureau) as 8,173 in 2010, with an estimated population level in 2011 shifting down to 8,061 and oscillating until 2015 to 7,871. The reduction of roughly 5% is unique to the Village when compared to surrounding municipalities, which appear to fluctuate roughly 1% up and down during this same period. This suggests that residents are leaving the Village and not being replenished by new arrivals at the same rate.
NOTE: Many of the statistics presented in this section had been posted on the Master Plan 2020 web site (http://www.voherkimer2020.com/) for public review throughout the development of this document.
The reason that these statistics are provided in a collective manner in this section, rather than associating each statistical profile in the various Characteristic Group they apply to, is because those later sections are focused on defining the future vision. Therefore these statistics will only be referenced in those later sections to support comparisons between the current state and the future state of the Village of Herkimer.
Therefore, to provide a logical sequence of these statistics, this section of the Master Plan 2020 will apply the following flow to provide some level of cause-effect association of the various demographic and industrial profiles of the Village:
- Population
- Ethnicity-Race
- Gender
- Age
- Marital Status
- Family and Household
- Education
- Employment
- Income
- Housing
Population
The population of the Village is referenced (per the US Census Bureau) as 8,173 in 2010, with an estimated population level in 2011 shifting down to 8,061 and oscillating until 2015 to 7,871. The reduction of roughly 5% is unique to the Village when compared to surrounding municipalities, which appear to fluctuate roughly 1% up and down during this same period. This suggests that residents are leaving the Village and not being replenished by new arrivals at the same rate.
Ethnicity-Race
The Village of Herkimer has a demographic profile that is not dissimilar from municipalities in the area. The chart below notes that the majority of residents (averaging roughly 95%) are white with a mix of minority races. Noteworthy is the gradual reduction in the white residents and an increase in profile of Asian and those of “some other race”. The specifics of why such a transition has occurred is not going to be assessed in this document, but the rise in racial minorities has to be considered when assessing the future state of the Village and how it will support this growing cultural mix.
The Village of Herkimer has a demographic profile that is not dissimilar from municipalities in the area. The chart below notes that the majority of residents (averaging roughly 95%) are white with a mix of minority races. Noteworthy is the gradual reduction in the white residents and an increase in profile of Asian and those of “some other race”. The specifics of why such a transition has occurred is not going to be assessed in this document, but the rise in racial minorities has to be considered when assessing the future state of the Village and how it will support this growing cultural mix.
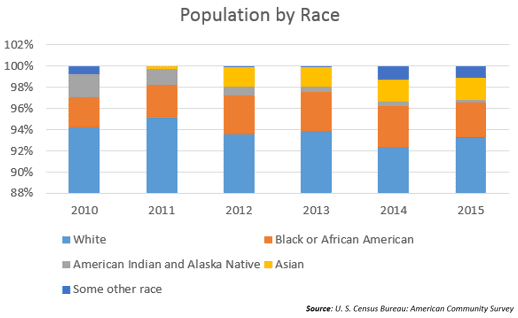
Since it is not definitely stated in the US Census Bureau statistics, we look to the Sterling’s Best Places, to detail how it defines the ethnic profiles, which appear to have a high similarity to the US Census Bureau:
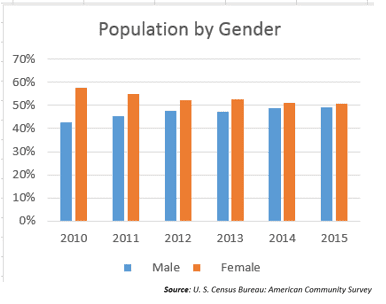
The gender breakdown of the Village (as depicted in the chart below) shows a slight shift over the past five years with the male population rising from 43% in 2010 to 48% in 2015. Note that it is necessary to combine the Population figures presented earlier to ascertain that, since the overall population has decreased since 2010, a decrease in the population percent by female means that they are decreasing at a higher rate than the male population in the Village.
As per the population figures provided earlier, the total population of 7,871 therefore breaks down to 3881 males and 3990 females making up the population of the Village of Herkimer.
- White – The percent of the population who have indicated their race as White, or reported entries such as Canadian, German, Italian, European, Lebanese, Near Eastern, or Arab.
- Black – The percent of the population who have indicated their race as Black, or reported entries such as African American, Afro-American, Black Puerto Rican, Jamaican, West Indian, or Haitian.
- Asian - The percent of the population who have indicated their race as Asian or Pacific Islander, including Asian Indian, Filipino, Cambodian, Thai, Bangladeshi, Burmese, Pakistani, Samoan, Hawaiian.
- American Indian and Alaska Native – The percent of the population who have indicated their race as American Indian, or Native American, Eskimo, or Aleut.
- Some other race – The percent of the population who have indicated their race as other than White, Black, Asian, or American Indian. Due the confusion of classifying Hispanic as an ethnicity and not a race, most Census respondents choosing this 'other' category were Hispanic.
The gender breakdown of the Village (as depicted in the chart below) shows a slight shift over the past five years with the male population rising from 43% in 2010 to 48% in 2015. Note that it is necessary to combine the Population figures presented earlier to ascertain that, since the overall population has decreased since 2010, a decrease in the population percent by female means that they are decreasing at a higher rate than the male population in the Village.
As per the population figures provided earlier, the total population of 7,871 therefore breaks down to 3881 males and 3990 females making up the population of the Village of Herkimer.
Age
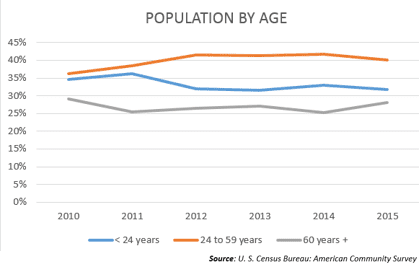
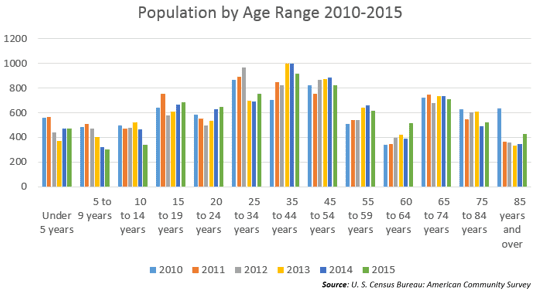
The population’s age profile in Herkimer have undergone a slight upward shifting of roughly 5% in the age range of 24-59 years old, with a similar downward shift of the age range of less than 24 years old. This fact could be used to surmise that those added to the 24-59 range were those that progressed (aged) into that range from the less than 24 range.
That would imply that families remain in the Village; that teenagers (15-19) shift into the 20-24 year range; and likewise shift from the 20-24 range to the 25-34, and so on.
For this to be effective, the Village has to have facilities, services and opportunities that support this transition. For teenagers to remain the Village as they graduate High School, there must be employment opportunity. To entice and ensure young adults remain in the Village, there have to not only be opportunity for employment in the region, but also facilities that appeal to this age range, often beginning a family.
A shift of population by age range most often exemplifies the transition of residents in the Village through the age ranges versus the rise or fall of populations in age ranges from new residents entering the Village, or existing residents departing.
To close out this critical statistical aspect of the current state of the Village, note the Population by Age Range 2010-2015 chart that provides a year-over-year breakdown for each 5 year incremented age range. Note the incremental reductions in age ranges of 5 to 9 years, and 10 to 14 years, all of which could be assumed to shift into the next age range as discussed earlier. However decline in the later age ranges may be primarily influenced by retirees leaving the Village for warmer weather or sadly passing on. Strong population counts in the mid-age ranges (25-45) is a positive indicator that the Village has the right population structure if it can maintain this age range in the years to come.
To close out this critical statistical aspect of the current state of the Village, note the Population by Age Range 2010-2015 chart that provides a year-over-year breakdown for each 5 year incremented age range. Note the incremental reductions in age ranges of 5 to 9 years, and 10 to 14 years, all of which could be assumed to shift into the next age range as discussed earlier. However decline in the later age ranges may be primarily influenced by retirees leaving the Village for warmer weather or sadly passing on. Strong population counts in the mid-age ranges (25-45) is a positive indicator that the Village has the right population structure if it can maintain this age range in the years to come.
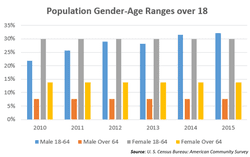
The Gender-Age chart below shows a similar rise in the male population graphed/noted in the prior “Gender” topic for Male 18-64 with very little change in all other Gender-Age groups. This suggests a growth in the male working population if considering those 65 years or older to be shifting to retirement and therefore leaving the active workforce. No significant changes have occurred in the female population by age range, though the decrease of females still holds true from the prior Gender statistic.
Marital Status
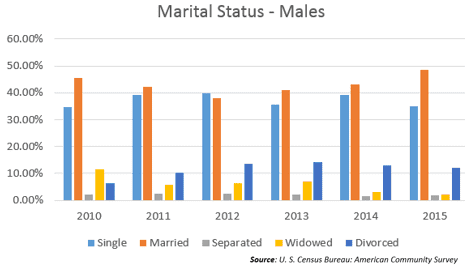
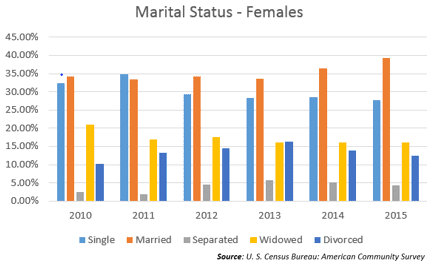
As denoted in the charts below, the population of the Village residents (15 years and older) are mostly married for males and females. The decrease in Single Males and Single Females appears to correlate to the increase in Married Males and Married Females. Similarly the increase in Divorced or Separated residents appears to increase as the amount of Married residents decrease. All this tends to suggest that the residents that undergo this marital status change remain in the Village, which further suggests that there is an appeal of the Village that results in residents remaining in the Village post those changes.
As denoted in the charts below, the population of the Village residents (15 years and older) are mostly married for males and females. The decrease in Single Males and Single Females appears to correlate to the increase in Married Males and Married Females. Similarly the increase in Divorced or Separated residents appears to increase as the amount of Married residents decrease. All this tends to suggest that the residents that undergo this marital status change remain in the Village, which further suggests that there is an appeal of the Village that results in residents remaining in the Village post those changes.
Family and Household
The profile of the households (totaling 3,308 as per 2015) in the Village provide an almost even split between Family and Nonfamily Households in 2010 per the table below. There has been a slight shift whereby family households have increased by 3% during the period of five years. A family is a group of two people or more (one of whom is the householder) related by birth, marriage, or adoption and residing together. A nonfamily household consists of a householder living alone (a one-person household) or where the householder shares the home exclusively with people to whom he/she is not related.
The profile of the households (totaling 3,308 as per 2015) in the Village provide an almost even split between Family and Nonfamily Households in 2010 per the table below. There has been a slight shift whereby family households have increased by 3% during the period of five years. A family is a group of two people or more (one of whom is the householder) related by birth, marriage, or adoption and residing together. A nonfamily household consists of a householder living alone (a one-person household) or where the householder shares the home exclusively with people to whom he/she is not related.

The average size of the both forms of households has decreased in the past five years roughly 6%. The nonfamily household average size is less than the family household size probably due to the family households qualifying because of children in the household.

Education
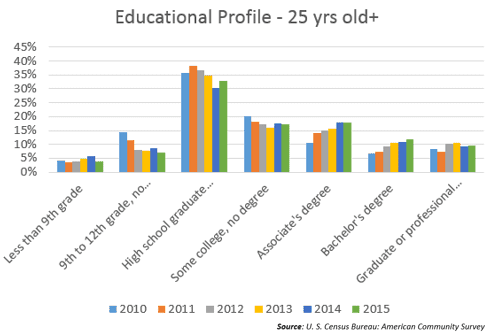
The Educational Profile below is comprised of roughly 75% of the Village residents as noted earlier in the statistics on Population (or 5,200 residents); those 25 years and over. The educational level of residents of the Village should have a direct correlation to the types of employment opportunities that they can qualify to fill. However, the need for higher educational levels can be challenged if the employment opportunities do not exist in the region.
The profile of the residents in the Village denotes the highest percentage of the population being of High School education, but also shows a 5% increase in residents that achieved an Associate’s and Bachelor’s degree. Those with Graduate degrees (such as Master’s) or Professional (such as a Doctorate) remain fairly consistent. As will be identified later, this provides a good base for the range of employment opportunities in the Village and surrounding region.
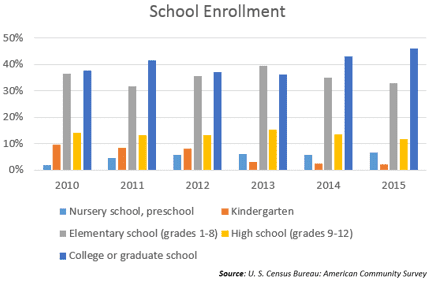
It was identified that roughly 12% of Village residents (800-900 or 40% of those enrolled in any school program) are actively engaged in obtaining higher educational levels per collegiate or graduate level degrees. This is depicted in the chart to the left and is expected to include a portion of residents who also attend Herkimer County Community College.
Employment
The employment level of those in the Village of Herkimer is influenced by opportunities within the Village, but also by those opportunities in surrounding municipalities. With the Village appearing to serve more as a bedroom community for industrial or manufacturing businesses in the surrounding municipalities, the Village is primarily one that offers employment in the retail and services industry. Though a small amount is representative of core manufacturing.
The chart to the below details the breakdown of industry within the Village from 2010-2015 showing trend areas in industry that should be taken into account in the development of the future state or vision of the Village.
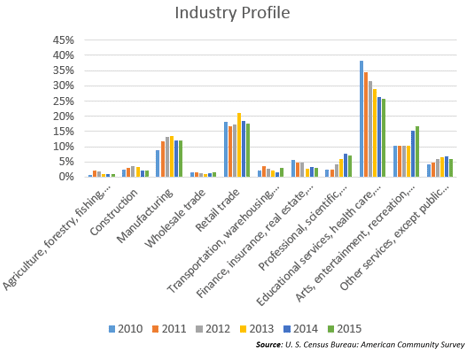
With the legend of the chart being cut off in its definition of the various industries that are represented in the Village, the bullet list below will assist in fully understanding the industries represented:
Though not listed in the chart above, Public Administration represents 4-5% of the employment opportunities and is not an industry that is considered influenced by market conditions, but rather tax revenue and community service requirements.
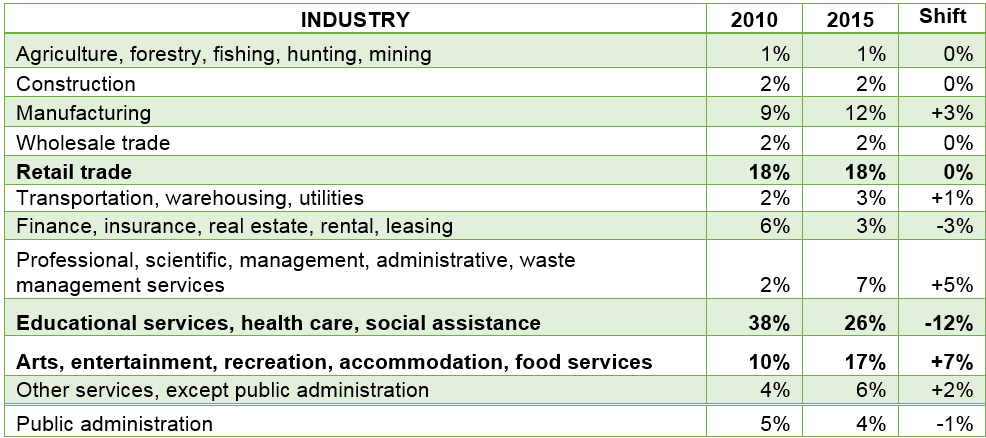
As detailed in the statistical profile of the Education levels of Village residents, the employment opportunities fit well with the fact that a majority of residents are High School educated, with a lesser amount having incrementally higher educational profiles.
Note that where the Retail industry sustains a reasonable profile, averaging 18% of the employment opportunities, the Educational Services, Health Care, and Social Assistance industry has fallen off dramatically over the past five years. Interesting to note is that the Arts, Entertainment, Recreation, Accommodation, and Food Services have risen over 50% (from 10% to 17%) in the past five years, indicating a trending that aligns with the Village being a community that is making efforts to service its residents in support of non-work activities (such as shopping, dining, and entertainment).
This growth in Arts, etc., when combined with the sustained Retail profile bodes well as a “current state” indicator when assessing the future state vision for the Village being one that furthers that trend line.
The chart below provides the number of individuals that comprise the Labor Force of the Village. This is impacted by the previously detailed age ranges, whereby those retiring would be leaving the labor force, while those entering the age range of 20-64 would be considered potential additions to the labor force. Interesting to note that while the overall population dropped by 5% over this five year period, the labor force increased over 25%.
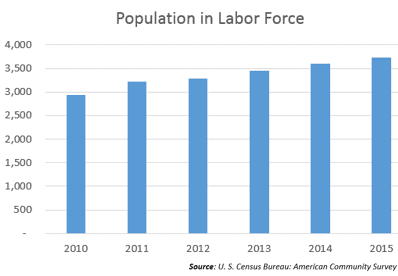
This could be accounted for by a decrease in the elderly population (as noted earlier), as well as the shifting of those from the teen age range into the 20+ age range. In any case, the workforce increase is a positive trend so long as there is sufficient employment opportunity.
The graph below shows the profile of employment noting a downward trend in employment (from 95-90%), corresponding with an uptick in unemployment (from 4-10%), noting a bubble in 2011 when it reached a period high of 11%.
The graph below shows the profile of employment noting a downward trend in employment (from 95-90%), corresponding with an uptick in unemployment (from 4-10%), noting a bubble in 2011 when it reached a period high of 11%.
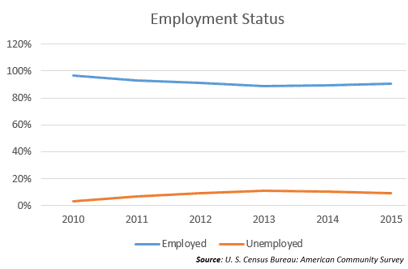
In straight percentage terms this would be considered a negative employment trend. However when combined with the 25% increase in labor force noted earlier, the increase in unemployment was less than the corresponding increase in labor force. Therefore the health of employment for the residents of the Village, regardless of whether those employment opportunities were within the walls of the Village or via the surrounding municipalities, is a positive. The labor force grew by 25% and yet the unemployment only grew by 6%, detailing an overall increase in employment opportunity by 19%.
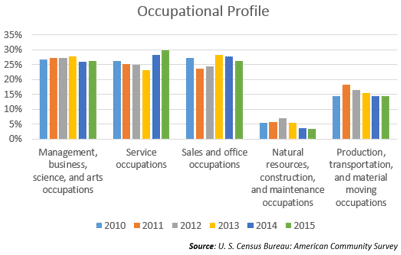
To breakdown the occupational profile of those Village residents that have employment during this statistical period, the chart to the right represents a somewhat stable profile. There are reinforcing trends regarding the slight increase in Service occupations (such as Retail, Accommodations, Food Services) with a corresponding decrease in Construction, Maintenance, Production, and Transportation industries.
To breakdown the occupational profile of those Village residents that have employment during this statistical period, the chart to the right represents a somewhat stable profile. There are reinforcing trends regarding the slight increase in Service occupations (such as Retail, Accommodations, Food Services) with a corresponding decrease in Construction, Maintenance, Production, and Transportation industries.
Though it is not graphed, US Census Bureau data shows that females in the labor force grew 10%, to over 1,700 while the employment of females also rose 4% to over 1,600 from 2010 to 2015. This is again a trend that shows a healthy economy whereby the labor force grew at the same time as employment levels grew as a percentage. This means that all the additional females that entered the labor force obtained employment, as well as those that were already in the labor force during that period.
The male population had a dramatic rise in labor force participants of 48% per roughly 1300 in 2010 expanding to over 1950 in 2015. Again – as with the female labor force, the male labor force was able to achieve growth in its employment level of 1%, to over 1770 working males, while increasing its pool of resources 48% over that same time period. Though no specific statistics exist as to where this male and female labor force was employed, the key is that growth in employment along with growth in the labor forces is a very positive indicator of the health of the Village.
Income
The ability for a geographic region to sustain employment is of little benefit if that employment doesn’t raise the income levels of its residents. As noted in the chart below, the Average Household Income has increased from roughly $36k to over $47k, signifying an increase of over 30%. The cost of living increase for the same period (based on the Cost of Living Calculator provided by the American Institute of Economic Research available at https://www.aier.org/cost-living-calculator) was only 8.72%, suggesting a normalized increase in income of over 20%.
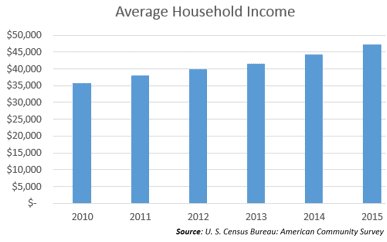
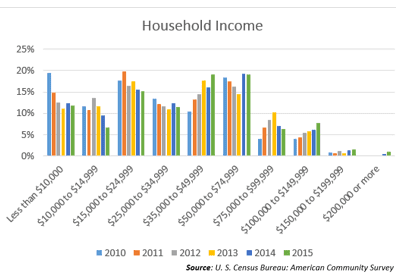
This again shows a healthy economic profile for those in the Village of Herkimer, and is further reinforced by the breakdown of income ranges charted to the right that shows a decrease in the lesser income levels from $10k to $35k, with an upward trending of the number of households in the income range of $35 to $50k.
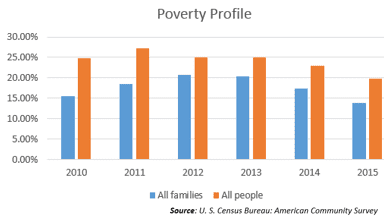
To further emphasis the improvement of the residents of the Village, the chart below shows that the Poverty Profile for All Families as well as All People have been reduced as well from 2012 to 2015.
As a point of reference, those in poverty (for example) would be a family of four that has a total income of less than $24,500 in 2015.
As a point of reference, those in poverty (for example) would be a family of four that has a total income of less than $24,500 in 2015.
housing
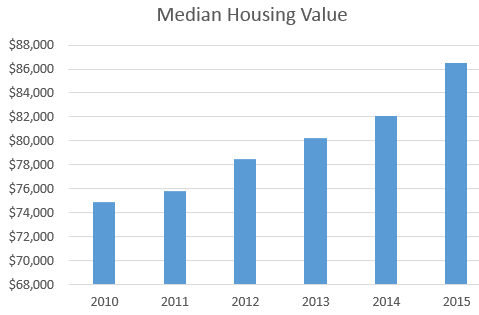
Another indicator of the health of a municipality is the profile of its housing market and how it has trended in recent years. The Median Housing Value chart to the right shows that the median value of housing in the Village has increased from $75k to over $86k, or 15%. Note that the term “median” means that this is the value that has an equal number of housing units less than and greater than that value. This is different than the “mean” value, which is the average unit price.
Note – using the median housing value is more effective in assessing a housing market, because it is not adversely affected by way of a set of very high (or very low) priced set of houses, which would have shifted the mean or average value disproportionately.
Note – using the median housing value is more effective in assessing a housing market, because it is not adversely affected by way of a set of very high (or very low) priced set of houses, which would have shifted the mean or average value disproportionately.
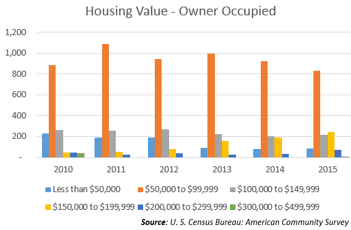
This increase in the median housing value is similar to the rise in the US housing market. To maintain equivalence in housing market value is a positive indicator of the health of the Village. The chart to the left provides the occupancy counts for each of the housing value ranges, of those units that are Owner-Occupied. Pay special attention to the growth of the units qualifying above $150k, and a corresponding reduction in units qualifying below that amount.
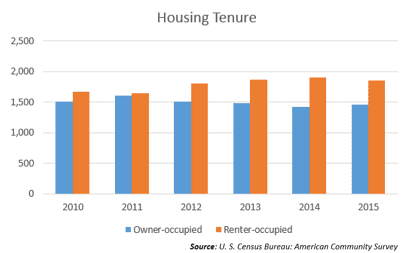
Interesting to view is the chart below that indicates that the rise in Renter-Occupied housing units which crested at roughly 60% of the available housing units in the Village and maintained an average of 56%. This includes all forms of housing units, from 1 unit dwellings, to duplex housings, to apartment building, and government subsidized housing such as Creekside Courts Apartment.
The fact that there has been a rise in rental units is influenced in part by the shift of age ranges noted earlier. When older residents leave for retirement or go into assisted care or pass away, the housing units generally get sold or are shifted to rental units.
The fact that there has been a rise in rental units is influenced in part by the shift of age ranges noted earlier. When older residents leave for retirement or go into assisted care or pass away, the housing units generally get sold or are shifted to rental units.
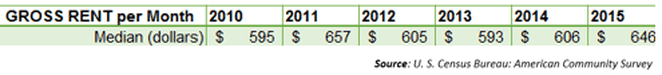
Rental units pricing, as with housing unit value have also seen fluctuations in median rental pricing as per the table below. The median rental price rose sharply in 2011, reset back to the $600 range before taking another leap in 2015. Supply and demand pricing seems to be influencing this rental pricing.
For details on the Gross Rent per Month, the chart below covers the range from 2010 to 2014. Review of this chart show some interesting statistics. Note that the number of units in the $500 to $749 range have increased almost 50% in the period covered. This may be directly correlated to the reduction in the number of higher priced rental units over that same period.
For details on the Gross Rent per Month, the chart below covers the range from 2010 to 2014. Review of this chart show some interesting statistics. Note that the number of units in the $500 to $749 range have increased almost 50% in the period covered. This may be directly correlated to the reduction in the number of higher priced rental units over that same period.
Similarly the reduction in units in the $200 to $299 range appears to correspond to the increase in units priced in the $300 to $499 price range. This is a form of price normalization based on consumer demand versus willingness to pay.
As a final note on the profile of Housing in the Village of Herkimer, the table below shows the level of vacant housing units that has increased from 262 in 2010 (or 8%) by a factor of 48% (or 126 units) in 2015. Vacant housing units are not those that are considered residential or multi-family commercial units.
As a final note on the profile of Housing in the Village of Herkimer, the table below shows the level of vacant housing units that has increased from 262 in 2010 (or 8%) by a factor of 48% (or 126 units) in 2015. Vacant housing units are not those that are considered residential or multi-family commercial units.
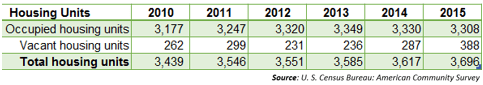
This rise in vacancies can be attributed to the reduced population as noted earlier in this section, as well as the reduced fitness of rental properties that are considered uninhabitable, or taken over due to an owner’s inability to pay the taxes and never sold and/or revitalized for habitation.
summary
To summarize, the Village of Herkimer has many positive indicates regarding the rise in its resident’s employment, education, and income levels. Its housing market is moving in positive direction, and it is establishing a community persona that is positioned well to take on a more retail and service focused profile. The population has seen a dip in the younger age group, which correlates to the reduced average family size.
It is therefore important that this Master Plan 2020 focus on how to keep the population motivated to remain, shop, dine, and be entertained in the Village of Herkimer. It must also focus on how the Village can increasing the appeal of those moving into the region to choose the Village as where they want to settle and raise their families. The Village of Herkimer is a family community and needs to ensure that our vision is one of serves this profile.
It is therefore important that this Master Plan 2020 focus on how to keep the population motivated to remain, shop, dine, and be entertained in the Village of Herkimer. It must also focus on how the Village can increasing the appeal of those moving into the region to choose the Village as where they want to settle and raise their families. The Village of Herkimer is a family community and needs to ensure that our vision is one of serves this profile.